

Explore how Terramate can uplift your IaC projects with a free trial or personalized demo.
Hello team,
We're excited to share our latest updates designed to improve your experience with Terramate. Read on to discover what our team has been working on!
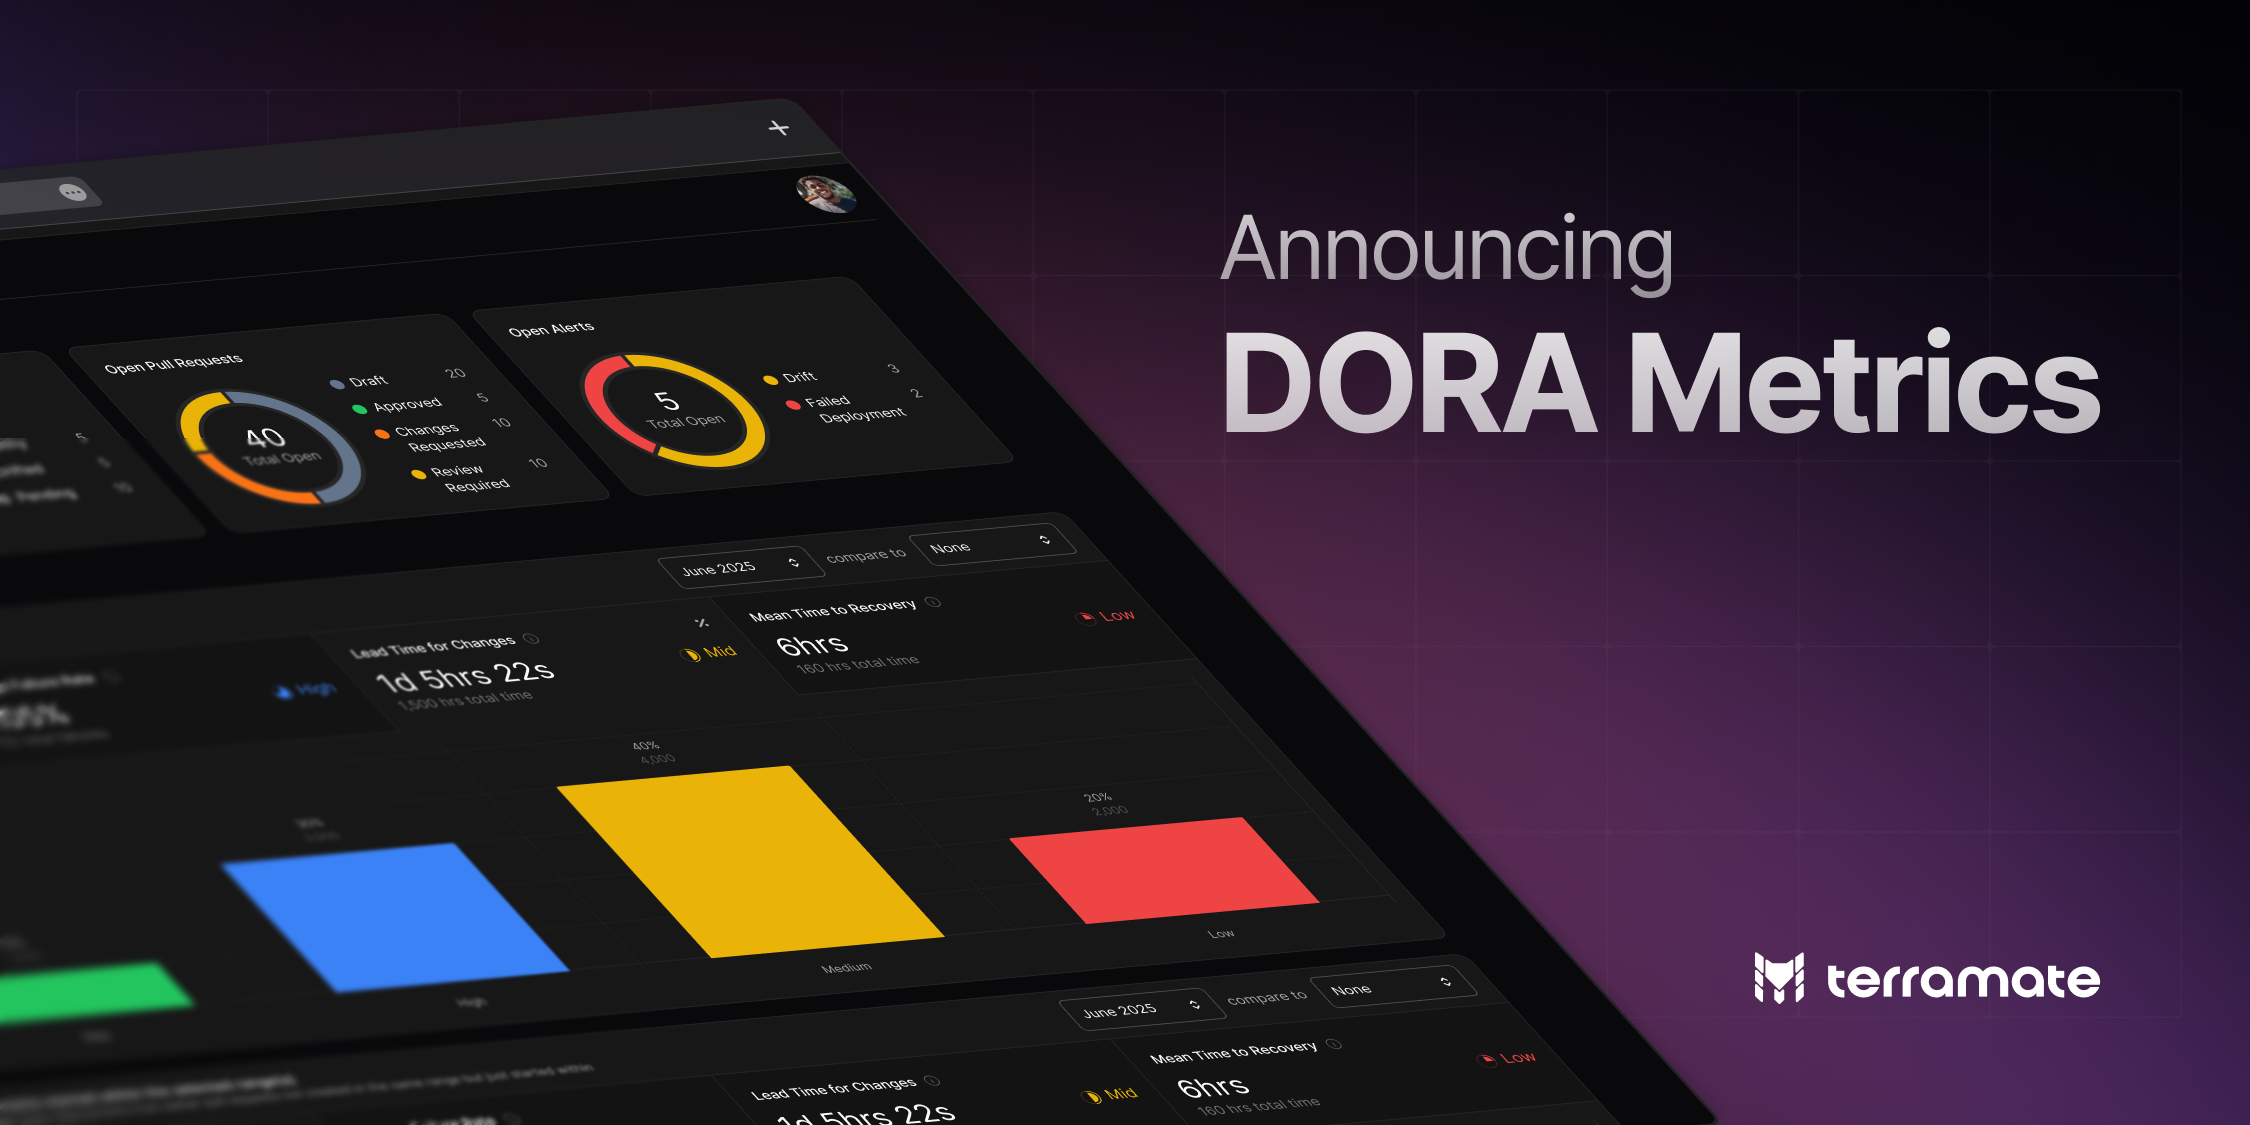
DORA Metrics
Measuring the impact of your DevOps or platform team and infrastructure is complex and requires the attribution and analysis of data across multiple systems and teams. DORA, derived from the DevOps Research and Assessment (DORA) team, is a set of four key performance indicators used to evaluate the performance of software development teams, particularly in a DevOps context. These metrics focus on both the speed and stability of software delivery.
We recently published an article that elaborates on the importance of DORA Metrics in Infrastructure Automation, explaining why having actionable DORA metrics in place is crucial.
For that, we just released out-of-the-box DORA metrics in Terramate Cloud, which allows you to measure and understand:
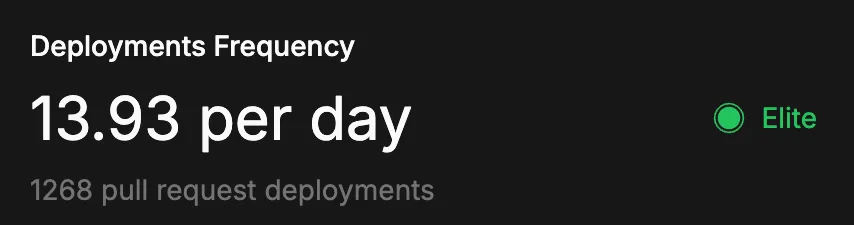
- Deployment Frequency: The number of executed deployments (e.g.
terraform apply) per time span. - Lead Time for Changes: The time between a Pull Request being created, ready for review, and the deployment starts/finishes/is successful.
- Change Failure Rate: The ratio between all successful and failed deployments (e.g.
terraform apply). - The mean time for recovery (MTTR): The time it takes to resolve failed deployments.
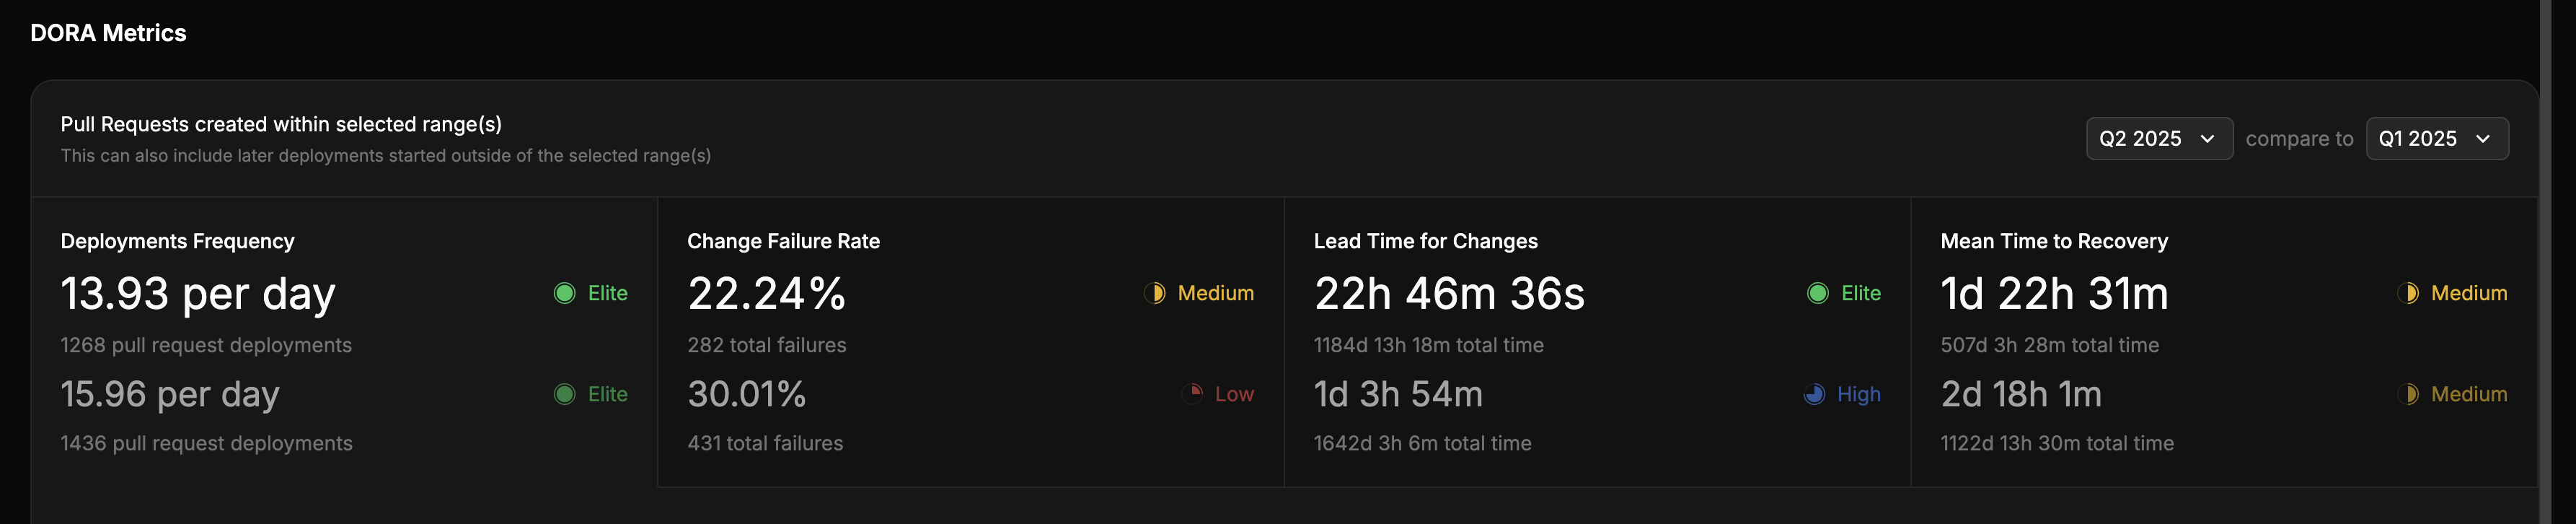
The dashboard of your Terramate Cloud organization displays all metrics in an actionable manner, enabling you to understand the impact of your infrastructure efforts.
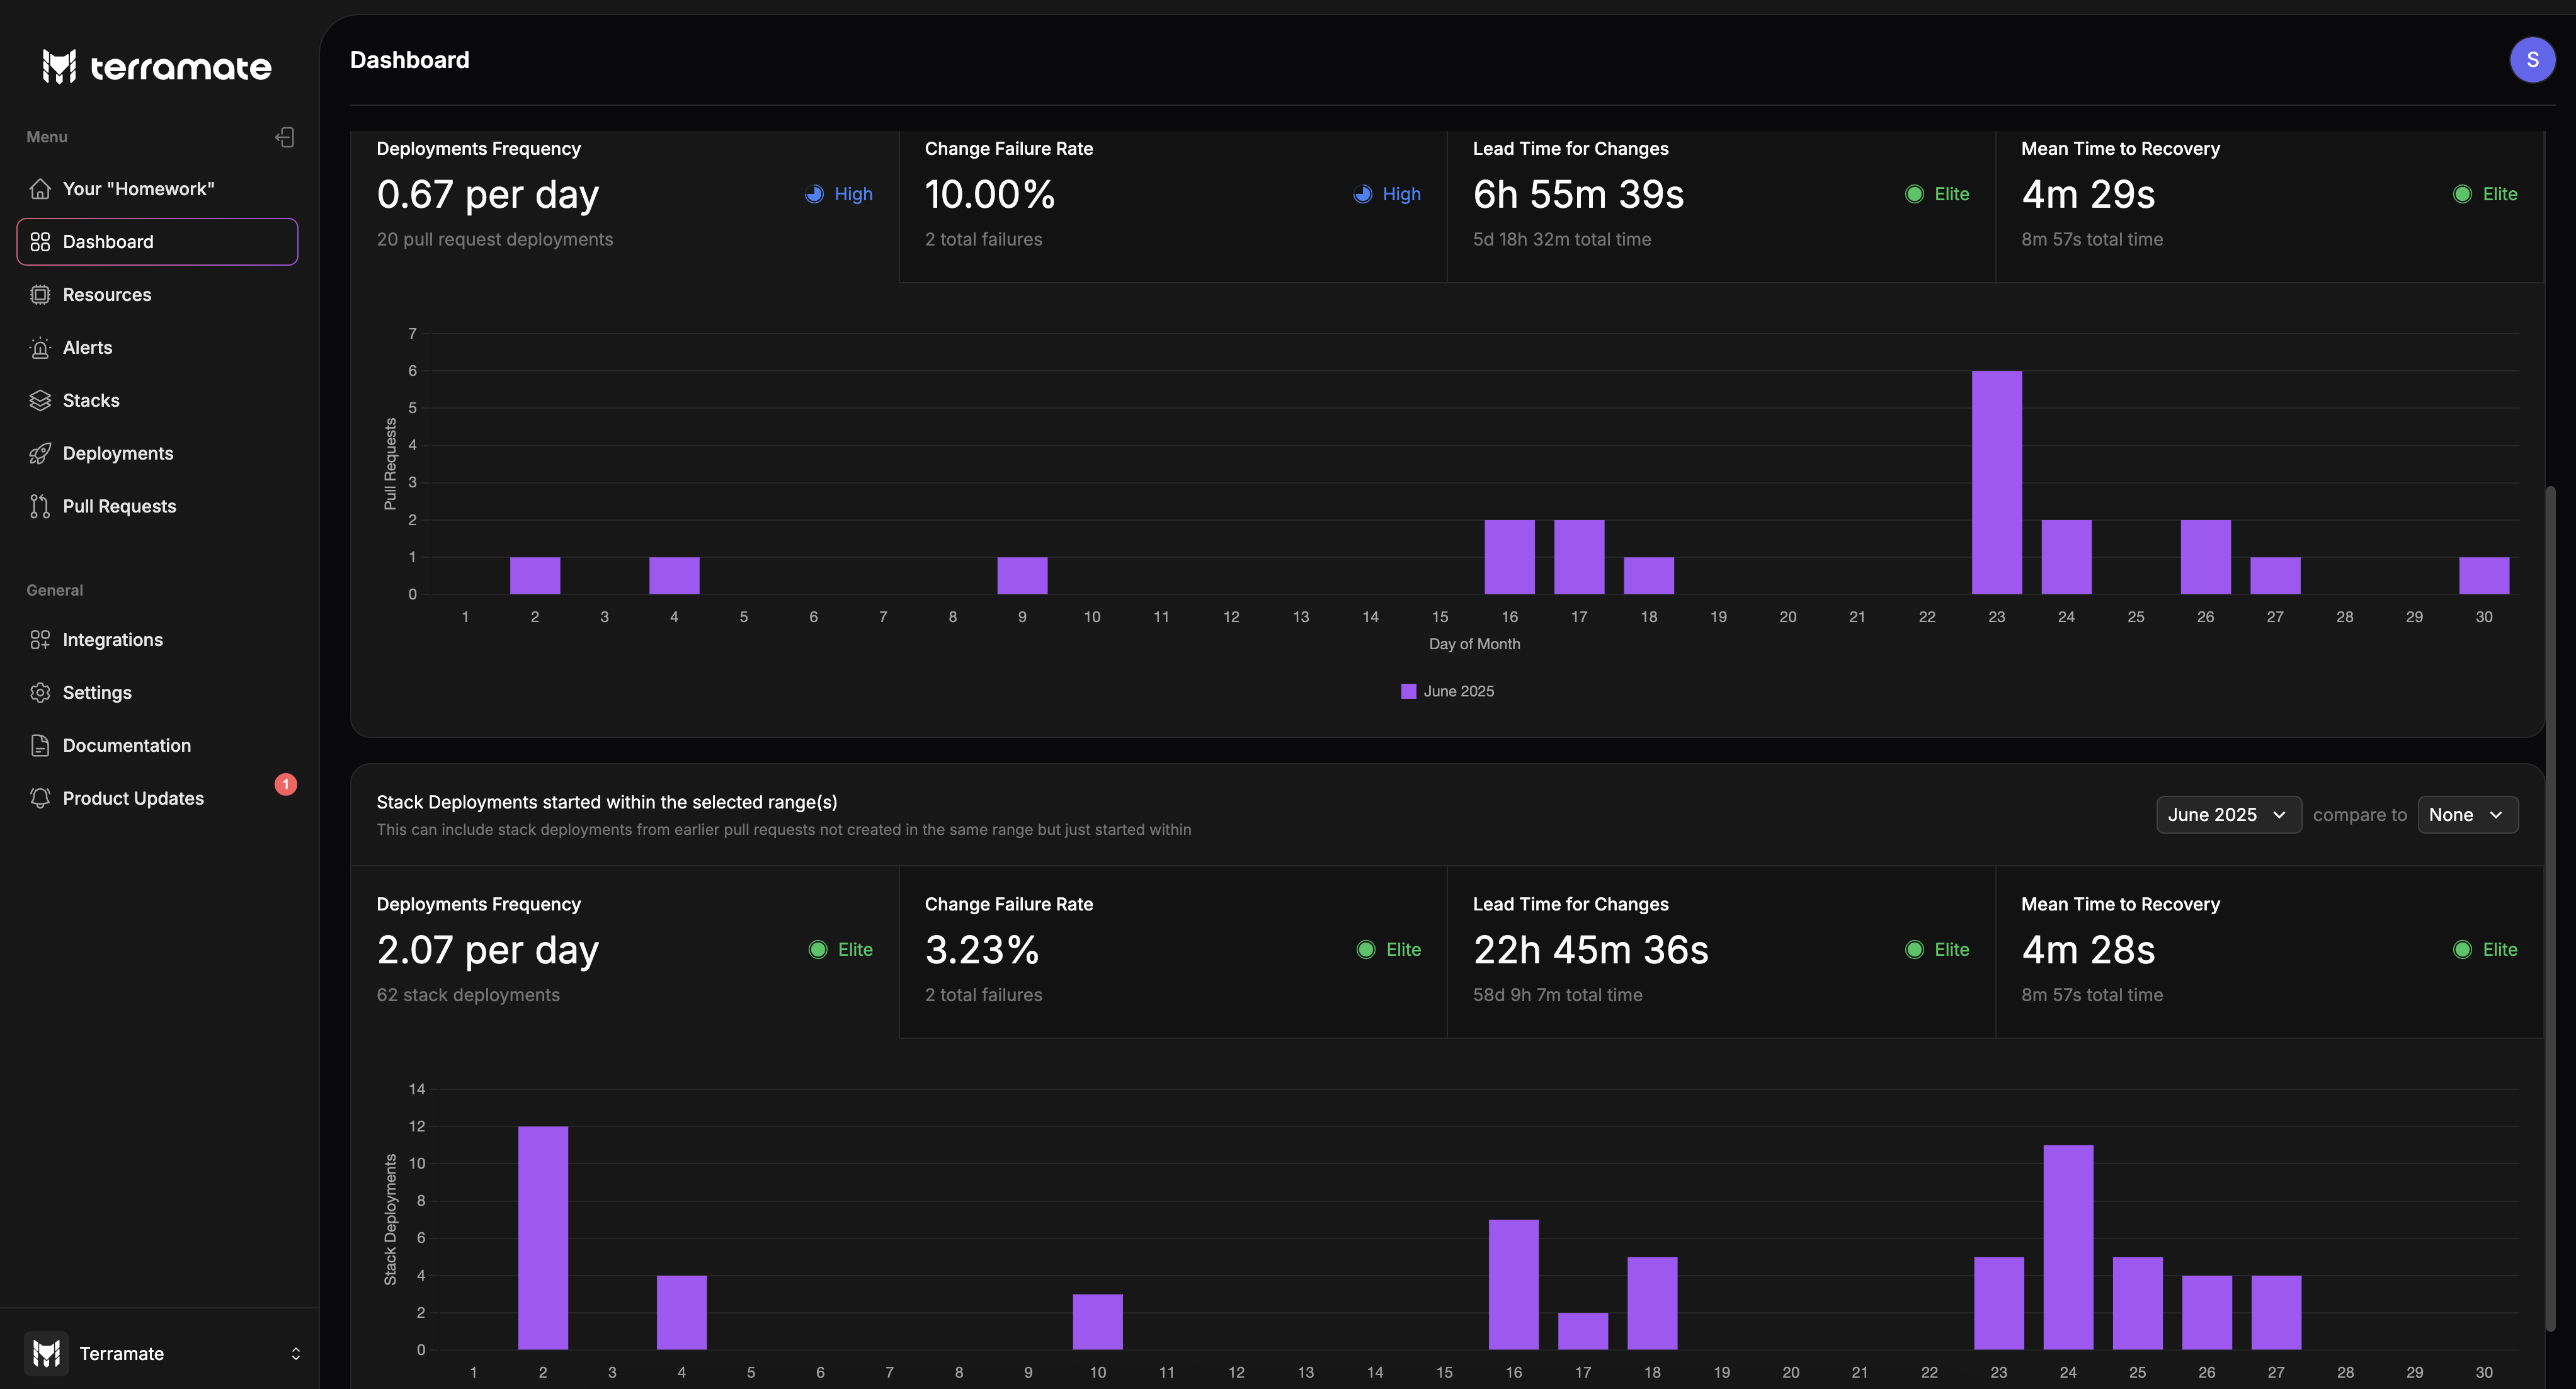
Here’s a quick overview of what you can do with the new DORA feature in Terramate Cloud:
Assess the Performance of your Team and Infrastructure
Terramate provides an automatic classification of your metrics into an Elite, High, Medium, and Low bucket, based on the metrics of the most recent DORA report. That way, you can easily understand the performance of your infrastructure teams with regards to each metric, and also compare them over time to previous periods.
Identify and resolve Bottlenecks
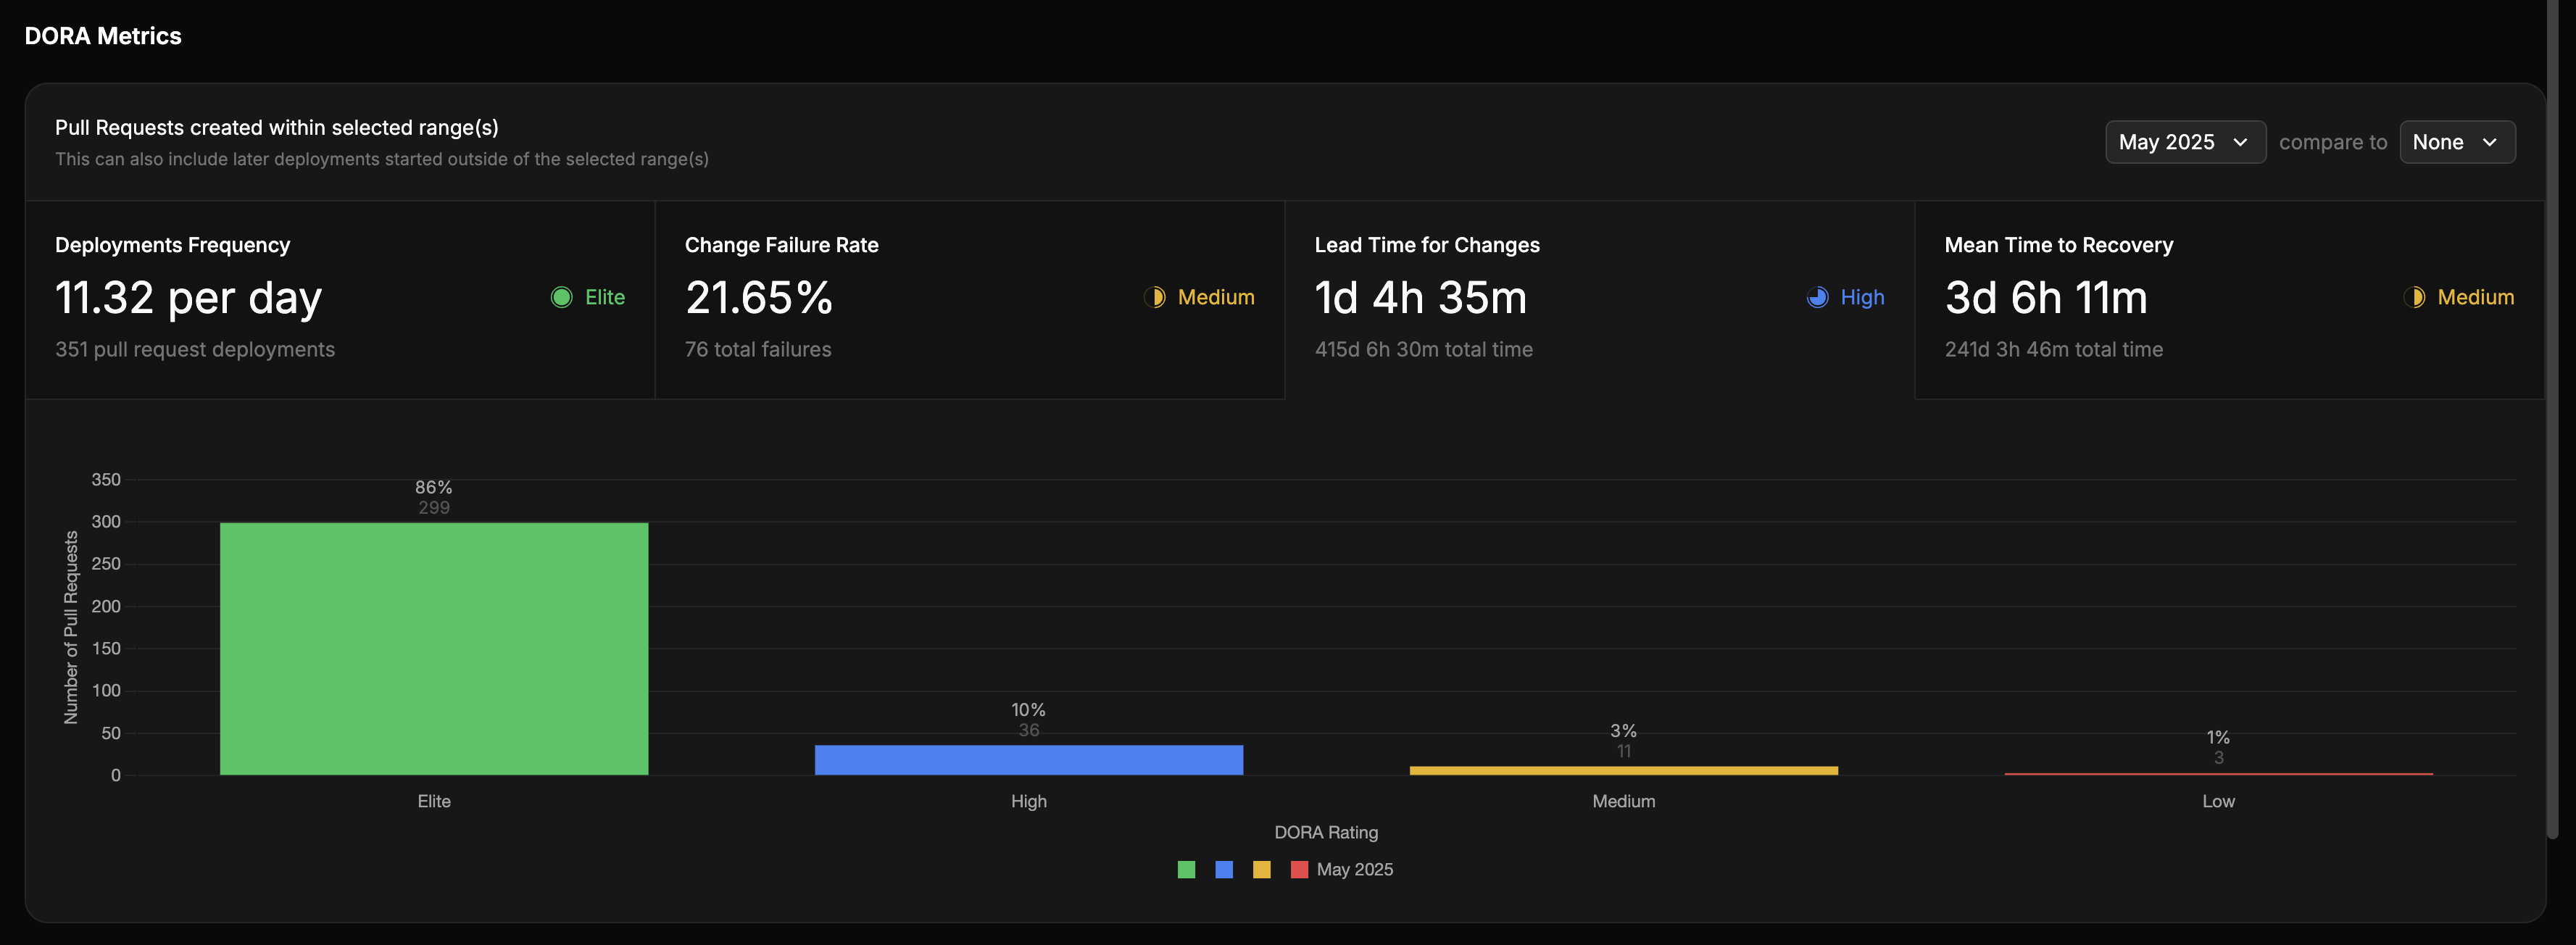
Once you have an understanding of whether it is a speed or reliability issue, Terramate allows you to drill down into a higher granularity.
E.g., below is the drill down for lead time for change. We see that 86% of deployments fall into the Elite, 10% in the High, 3% in the Medium, and 1% in the Low bucket. Thus, the overall “High” grade can probably be addressed by doing a deep dive on what went wrong with these few exceptions, dragging the average down. By just eliminating PRs gone horribly wrong in the future, this team can easily move to an “Elite” rating in this metric.
Compare DORA metrics over time
While comparing yourself against the DORA benchmarks is a great starting point, most organizations really want to compare their performance to themselves, i.e., their own performance from previous periods. As a manager, you typically would like to see that metrics either improve or, if they are good, at least stay the same. With Terramate, you can flexibly compare your metrics using time ranges on a granular level.
Understand metrics both on a PR and Stack level
While the PR metrics give you a better idea of the “who”, that is the team performance, the per stack metrics provide insights into the “what”, e.g., which stack deployments are causing trouble.
Availability
DORA metrics are now available in Terramate Cloud for all organizations and across all plans, i.e., including the free community plan. If you are interested in how Terramate Cloud can help measure and improve the performance of your infrastructure and teams, please book a demo with one of our experts.
Minor Changes
- We released Terramate CLI v0.14.0, which comes with significant performance improvements when orchestrating multiple stacks.
As always, we appreciate your feedback and support.
The Terramate Team 🚀